
The first part: abstract
Since the 1980s, the safety of sulfite residues in food has attracted wide attention. As a food additive, sulfite is widely used in food industry because of its anti-corrosion, bleaching and coloring effects. If the human body long-term intake of excessive sulfur dioxide will lead to affect calcium and phosphorus absorption, low immunity, and serious gastrointestinal reactions. Edible fungi contain a lot of protein, fat, multivitamins, crude polysaccharides and amino acids. Some studies have found that fungi contain effective elements of the human body’s anti-cancer ability, but because they need to be mothproof and anti-corrosion treatment, sulfites are added in the processing process or through fumigation for anti-oxidation and anti-corrosion treatment. To this end, the “List of non-edible Substances that may be illegally added to food and food additives that are easy to abuse” published in 2008 stipulates sulfur dioxide as a non-edible substance, and prohibits its large use in foods such as white pepper, granulated sugar, preserved fruit, ginger and fresh mushrooms. The composition of edible fungi is very complex and different, and there are many different methods for the detection of sulfite (measured by sulfur dioxide), and the detection principle is quite different. So far, the methods used to detect sulfites in edible fungi include iodimetry, spectrophotometry, titration and chemiluminescence. The purpose of this study is to find out a more suitable method for the determination of sulfites (SO2) in edible fungi by analyzing and comparing the recovery, accuracy and repeatability of three different methods (spectrophotometry, iodometry and ion chromatography), which can serve as a reference for the research of SO2 methods.
Part two: Materials and methods
1.1 Sample procurement and processing
To purchase edible fungi in many regions of Northeast China, select 54 batches (each batch about 2kg) to bake at 45℃ for 8h to the moisture content < 10%, and crush in the crusher.
1.2 Experimental consumables
UV-1700 ultraviolet spectrophotometer,
Electronic balance,
Kjeldahl nitrogen apparatus,
CS-2000+ ion chromatography,
Ultra-pure water machine,
Sodium sulfite standard solution (1000μg/ml),
Sodium hydroxide, analytically pure; Hydrogen peroxide (analytically pure); Pararosaniline hydrochloride (standard pure); Starch (analytical pure),; Disodium EDTA (analytically pure).
Electronic balance,
Kjeldahl nitrogen apparatus,
CS-2000+ ion chromatography,
Ultra-pure water machine,
Sodium sulfite standard solution (1000μg/ml),
Sodium hydroxide, analytically pure; Hydrogen peroxide (analytically pure); Pararosaniline hydrochloride (standard pure); Starch (analytical pure),; Disodium EDTA (analytically pure).
1.3 Experimental process of three different methods
1.3.1 Spectrophotometry
1.3.1.1 Sample treatment was determined according to the Ministry of Agriculture standard NY/T1373-2007 “Method for the determination of sulfur dioxide residue (Spectrophotometry)”. Precision weighing the treated sample of about 1.000g, placing it in a 100ml round-bottom flask, adding 2ml ethanol, 1ml acetone-ethanol solution, 2ml n-octanol, 20ml deionized water, and quickly adding 10ml hydrochloric acid solution, turn on the automatic condensing reflux device switch quickly, and connect a rubber tube to the upper interface of the condensing tube as a pilot pipe. Insert into 50ml pear-shaped bottle, the pear-shaped bottle is 20ml formaldehyde solution absorbed first (the formaldehyde solution should be diluted 100 times for use), formaldehyde is the absorption liquid (the end of the catheter should be inserted below the level of the absorption liquid). Heat the solution in the round-bottomed flask to boiling and keep the solution in a slightly boiling state: boil for 1.5h and stop heating. After cooling at room temperature, the absorption solution was transferred to a 25ml volumetric bottle, and the capacity was determined to be 25ml. Then, the blank experiment was performed.
1.3.1.2 Two groups of 25ml glass test tubes were selected for standard curve configuration, with 5 tubes in each group, which were divided into groups A and B. Group A took the sulfur dioxide (1μg/ml) standard solution (1.00, 2.00, 4.00, 8.00, 10.00ml), which was configured before, and made the sulfur dioxide content in the solution (1.00, 2.00, 4.00, 8.00, 10.00μg), and used formaldehyde solution to volume to 10ml. Then add 0.5ml sodium hydroxide solution (5mol/L); Group B was added with 1ml of pararosaniline hydrochloride solution (concentration 0.05%), group A was mixed and quickly added to group B, and immediately mixed for color development.
1.3.1.2 Two groups of 25ml glass test tubes were selected for standard curve configuration, with 5 tubes in each group, which were divided into groups A and B. Group A took the sulfur dioxide (1μg/ml) standard solution (1.00, 2.00, 4.00, 8.00, 10.00ml), which was configured before, and made the sulfur dioxide content in the solution (1.00, 2.00, 4.00, 8.00, 10.00μg), and used formaldehyde solution to volume to 10ml. Then add 0.5ml sodium hydroxide solution (5mol/L); Group B was added with 1ml of pararosaniline hydrochloride solution (concentration 0.05%), group A was mixed and quickly added to group B, and immediately mixed for color development.
1.3.2 Iodine measurement
According to the national standard GB5009.34-2016 “Determination of sulfur dioxide in food”, prepare the distillation instrument, lead acetate (20g/L) solution as the absorption solution, collect about 10ml of distilled liquid into the iodine measuring bottle, add hydrochloric acid solution (1+1)10ml and the prepared 10g/L starch indicator. It was titrated with 0.010mol/L iodine standard solution (10mol/L) until the solution turned blue, and the color did not fade within 30 seconds. At the same time, blank correction experiment was performed.
1.3.3 Ion chromatography
1.3.3.1 Chromatographic conditions
Protective column :AG-194×50; Separation column :AS-19(4mm×250mm); Potassium hydroxide was eluted with a concentration of 10.0mmol/L for 8-12 min and a flow rate of 1.0ml/min. Column temperature 37℃; Automatic regeneration suppressor: suppression current 50mA; Conductivity detector: Sample size 100μl.
1.3.3.2 Standard curve preparation process
Accurately measure 5.0ml standard solution (1000μg/ml) in a 50ml volumetric bottle, fill it with ultra-pure water to the scale, mix it quickly, and use it as a standard liquid with a concentration of 100μg/ml. Accurately absorb 1.00, 2.00, 5.00, 8.00, 10.00ml of the used liquid into a 10ml volumetric bottle, use the ultra-pure constant volume to the scale, and quickly mix it to obtain the standard curve with the concentrations of 10.0, 20.0, 50.0, 80.0, 100.0μg/ml, respectively.
1.3.3.3 Sample pretreatment
Weigh the crushed fungus sample 2.000g(accurate to 0.001g) into the Kjeldahl nitrogen determination tube, add 100ml ultra-pure water, connect the Kjeldahl nitrogen analyzer, set the instrument parameters, add 10ml(1+1) hydrochloric acid solution into the Kjeldahl nitrogen determination tube, the steam capacity is 70%, and the distillation time is 10min. 25ml3% hydrogen peroxide solution in a 50ml pear-shaped bottle was used as the absorption solution. After distillation, the solution was poured into a volumetric bottle and filled with deionized water to the scale. The sample was determined by ion chromatography after 0.45μm filter membrane.
1.3.4 Recovery rate experiment of three methods
The blank samples were marked by three different methods and the recovery rate was calculated. The results of 6 parallel tests of blank samples with 10, 20 and 30mg/kg added showed that the recoveries were all over 90%, RSD < 10%, and the recovery was good.
1.3.5 Calculation
Spectrophotometric calculation formula :W(mg/kg)=(m1-m0)×V×1000/m2×V0×1000. Where, W: mass concentration of residual sulfur dioxide, mg/kg; m1- Sulfur dioxide content μg found in the sample from the standard curve; Sulfur dioxide content found blank in M0-standard curve, μg; V is the constant volume of the sample, ml; V0- is the volume of the distillation used for determination, ml.
Iodine method calculation formula :W(mg/kg)=(V-V0)×C×0.032×1000/m. Where, W- is the residual mass concentration of sulfur dioxide, mg/kg; V- Determination of the volume of standard titrant consumed by bacterial sample solution, ml; V0- Volume of standard titrant consumed by blank fungus sample, ml; c- is the concentration of iodine standard solution for titration, mol/L; 0.032- Mass of sulfur dioxide equivalent to consuming 1ml of iodine standard solution (1mol/L), g; m- The weighing weight of the fungus sample, g.
Ion chromatography formula :W(mg/kg)=C×V×F×0.6669/m. Where, the residual mass concentration of W-sulfur dioxide is mg/kg; On the C-standard curve, the concentration of sulfite in fungus samples was μg/ml. V- Measurement volume, ml; F- dilution ratio; 0.6669- conversion coefficient between sulfate and sulfur dioxide; m- Weight of the fungus sample, g.
Iodine method calculation formula :W(mg/kg)=(V-V0)×C×0.032×1000/m. Where, W- is the residual mass concentration of sulfur dioxide, mg/kg; V- Determination of the volume of standard titrant consumed by bacterial sample solution, ml; V0- Volume of standard titrant consumed by blank fungus sample, ml; c- is the concentration of iodine standard solution for titration, mol/L; 0.032- Mass of sulfur dioxide equivalent to consuming 1ml of iodine standard solution (1mol/L), g; m- The weighing weight of the fungus sample, g.
Ion chromatography formula :W(mg/kg)=C×V×F×0.6669/m. Where, the residual mass concentration of W-sulfur dioxide is mg/kg; On the C-standard curve, the concentration of sulfite in fungus samples was μg/ml. V- Measurement volume, ml; F- dilution ratio; 0.6669- conversion coefficient between sulfate and sulfur dioxide; m- Weight of the fungus sample, g.
Part Three: Results
2.1 Spectrophotometry
The linear range of spectrophotometry was between 0.9989 and 0.9993, and the linearity was good. However, 5 samples in the detected samples exceeded the standard and were verified by ion chromatography as sample matrix interference. The recovery rate of spectrophotometry is 85.1% ~ 118.5%, and the average RSD is 5.4%. Due to the complex composition in the sample, the interference is large.
The experimental results of the recovery rate by spectrophotometry are shown in Table 1.
The experimental results of the recovery rate by spectrophotometry are shown in Table 1.
| Table 1 Sulfur dioxide recovery experiment by spectrophotometry (mg/kg) | |||||||||
| background concentration | Spiked concentration | estimated value | RSD (%) | Average recovery rate (%) | |||||
| 1 | 2 | 3 | 4 | 5 | 6 | ||||
| 0.00 | 10 | 9.58 | 8.51 | 8.97 | 9.26 | 9.36 | 9.42 | 4.22 | 91.8 |
| 0.00 | 20 | 21.15 | 20.57 | 22.35 | 19.88 | 18.98 | 21.54 | 5.81 | 103.7 |
| 0.00 | 30 | 33.54 | 32.45 | 31.78 | 34.53 | 35.54 | 29.87 | 6.17 | 109.8 |
2.2 Iodimetry
The results showed that the recovery rate was 81.5% ~ 130.5% by iodine method, and the average RSD was 5.32%. The experimental results of iodine recovery are shown in Table 2. Due to the complexity of the reagent used in the experiment, some components of the sample react with the reagent, which causes great interference.
| Table 3 Recovery test of sulfur dioxide ion chromatography (mg/kg) | |||||||||
| background concentration | Spiked concentration | estimated value | RSD (%) | Average recovery rate (%) | |||||
| 1 | 2 | 3 | 4 | 5 | 6 | ||||
| 0.00 | 10 | 9.83 | 9.17 | 10.25 | 9.26 | 9.46 | 9.57 | 4.16 | 95.9 |
| 0.00 | 20 | 20.57 | 20.42 | 20.57 | 19.84 | 20.65 | 19.62 | 2.15 | 101.4 |
| 0.00 | 30 | 32.55 | 32.16 | 31.38 | 29.85 | 29.77 | 29.87 | 4.08 | 103.1 |
2.3 Ion chromatography
The linear range of ion chromatography was 0.9991 ~ 0.9997, and the recoveries were 91.7% ~ 108.5%. The average RSD is 3.46%, the separation effect is good, the chromatographic peak has no interference, and the linear range is good. The recovery experiment of ion chromatography is shown in Table 3.
| background concentration | Spiked concentration | estimated value | RSD (%) | Average recovery rate (%) | |||||
| 1 | 2 | 3 | 4 | 5 | 6 | ||||
| 0.00 | 10 | 9.83 | 9.17 | 10.25 | 9.26 | 9.46 | 9.57 | 4.16 | 95.9 |
| 0.00 | 20 | 20.57 | 20.42 | 20.57 | 19.84 | 20.65 | 19.62 | 2.15 | 101.4 |
| 0.00 | 30 | 32.55 | 32.16 | 31.38 | 29.85 | 29.77 | 29.87 | 4.08 | 103.1 |
Part Four: Discussion
In this paper, the sulfur dioxide residue in fungal food was detected by ion chromatography, compared with iodine method in national standard method and spectrophotometry in NY/T1373-2007 standard of Ministry of Agriculture, and the determination method of sulfur dioxide in edible fungi was discussed. China’s current effective limit standard GB2760-2014 “Standard for the use of food additives” put forward strict regulations on the residual amount of sulfites (measured by sulfur dioxide) in food: the amount of sulfites used in edible bacteria food by drying method shall not exceed 0.05g/kg(measured by sulfur dioxide), and the provisions for fresh bacteria are more strict that there shall not be detection. GB5009.34-2016 “Determination of sulfur dioxide in food” is the current effective national standard method, which stipulates that the determination method of sulfite (sulfur dioxide) residue is iodine method, which is received by lead acetate absorption solution, and the condensation reflux in the heating process, so that all sulfur dioxide is absorbed by lead acetate, and the effect is good. The distillation time of this method is long, and the determination of large quantities of samples is difficult. There are many unknown components in fungi. The distillation method uses starch indicator as the chromogenic agent. During the titration process with iodine standard solution, the interference from titration end point to blue sometimes is large, which may lead to instability and poor reproducibility of the results, and the measurement results are prone to be high. The spectrophotometric method adopted by the Ministry of Agriculture has good precision and accuracy, but a large number of toxic reagents used in the experiment process have greater harm to the human body, and there will be a lot of interference in the color development process, resulting in high results. Ion chromatography has low interference, simple operation, good reproducibility and stable results. It is suitable for mass determination of fungal food.
The samples of this study are fresh fungi and dried mushrooms in different areas of Northeast China. Three common laboratory methods are used to test and compare the residual amount of sulfur dioxide. The experimental results show that the ion chromatography method has good effect, good repeatability and less interference when determining the content of sulfite (SO2 meter) residue in fungal food. Some samples measured by the three methods are quite different, mainly caused by interference, and the iodine method has a long distillation time, and the spectrophotometry method is cumbersome and has too many toxic reagents, so it is not suitable for the detection of a large number of fungal samples. The experiment shows that the sulfur dioxide can be converted into sulfate by using 3% hydrogen peroxide solution as the absorption liquid of sulfur dioxide. The method of Kjeldahl nitrogen determination is used for distillation, which saves the time of distillation, has high efficiency and stable results. The results also show that the ion chromatography method has good reproducibility and high accuracy, and is suitable for the determination of sulfur dioxide residue in large quantities of bacterial food.
Due to the complexity of various components in fungal food and many unknown volatile substances, some substances will have a certain reducibility, and these reductive substances may have different degrees of REDOX reaction with iodine standard solution during the experiment, resulting in higher experimental results. The standard results also show that iodine method is higher than that of ion chromatography. Due to certain differences in different places and different food ingredients of fungi, the color of lead acetate after absorption as an absorption solution is also different, and the blue change of the titration end point of many fungal samples is not obvious, resulting in the failure to accurately determine the end point, inaccurate results, poor stability and repeatability. Compared with iodimetry, spectrophotometry has better linear range and less interference, but the operation steps are complicated and the toxicity of reagents is relatively large. Compared with the previous two methods, ion chromatography has no interference in ion peak, good peak shape, high accuracy, and pretreatment is simpler than spectrophotometry, which is suitable for multi-batch detection of fungal food. It provides an important basis for the study of sulfur dioxide in fungal food.
The samples of this study are fresh fungi and dried mushrooms in different areas of Northeast China. Three common laboratory methods are used to test and compare the residual amount of sulfur dioxide. The experimental results show that the ion chromatography method has good effect, good repeatability and less interference when determining the content of sulfite (SO2 meter) residue in fungal food. Some samples measured by the three methods are quite different, mainly caused by interference, and the iodine method has a long distillation time, and the spectrophotometry method is cumbersome and has too many toxic reagents, so it is not suitable for the detection of a large number of fungal samples. The experiment shows that the sulfur dioxide can be converted into sulfate by using 3% hydrogen peroxide solution as the absorption liquid of sulfur dioxide. The method of Kjeldahl nitrogen determination is used for distillation, which saves the time of distillation, has high efficiency and stable results. The results also show that the ion chromatography method has good reproducibility and high accuracy, and is suitable for the determination of sulfur dioxide residue in large quantities of bacterial food.
Due to the complexity of various components in fungal food and many unknown volatile substances, some substances will have a certain reducibility, and these reductive substances may have different degrees of REDOX reaction with iodine standard solution during the experiment, resulting in higher experimental results. The standard results also show that iodine method is higher than that of ion chromatography. Due to certain differences in different places and different food ingredients of fungi, the color of lead acetate after absorption as an absorption solution is also different, and the blue change of the titration end point of many fungal samples is not obvious, resulting in the failure to accurately determine the end point, inaccurate results, poor stability and repeatability. Compared with iodimetry, spectrophotometry has better linear range and less interference, but the operation steps are complicated and the toxicity of reagents is relatively large. Compared with the previous two methods, ion chromatography has no interference in ion peak, good peak shape, high accuracy, and pretreatment is simpler than spectrophotometry, which is suitable for multi-batch detection of fungal food. It provides an important basis for the study of sulfur dioxide in fungal food.
Part Five: Instrument parameters
UV-1700PC UV-visible spectrophotometer
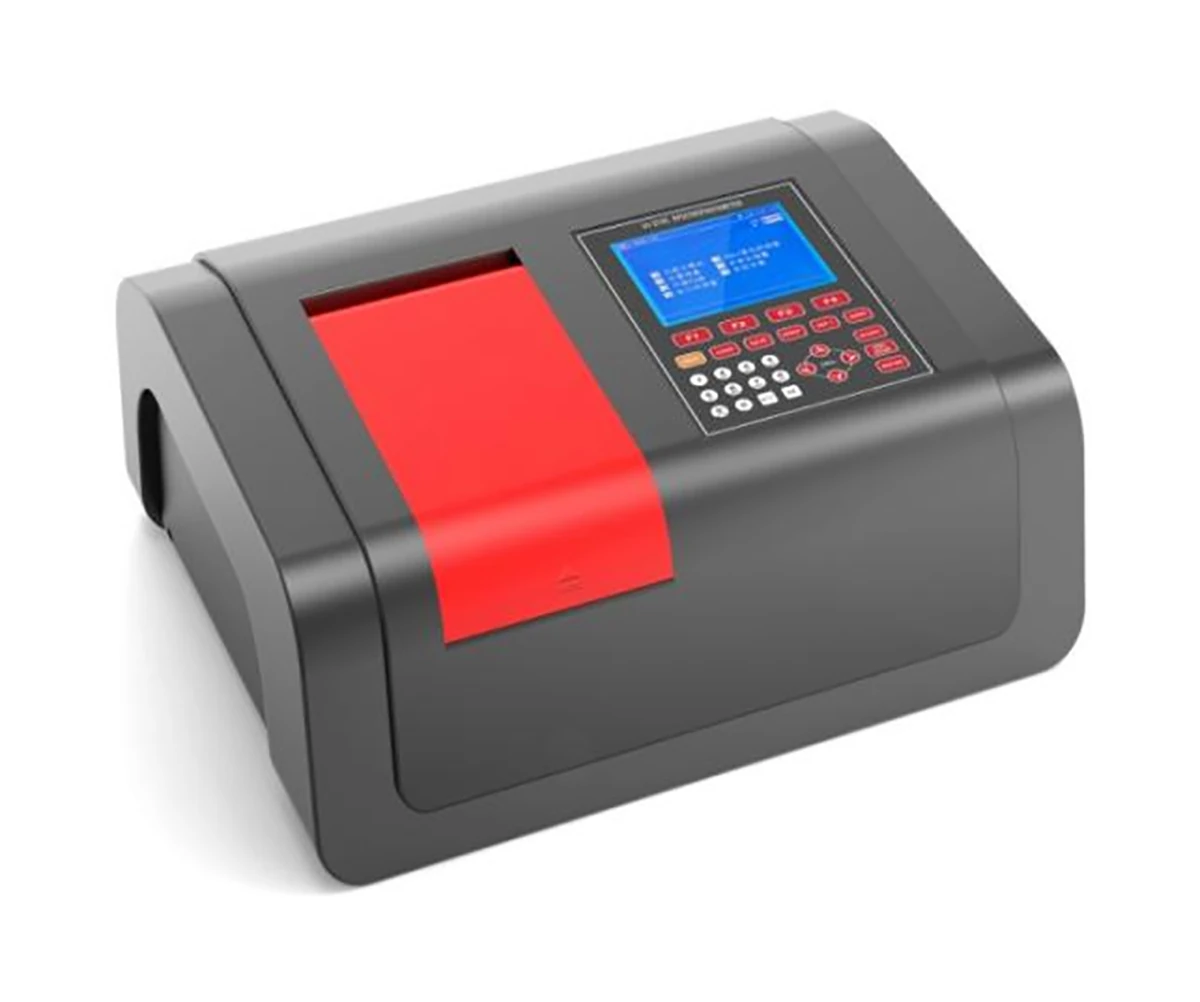
Instrument characteristics
The UV-1700 successfully achieves the strict requirements of high precision and high reliability measurement, and can meet the requirements of various applications, which can be used in biological research, biological industry, pharmaceutical analysis, pharmaceutical, teaching research, environmental protection, food hygiene, clinical testing, health and epidemic prevention and other fields.
Wide wavelength range, can meet the requirements of various fields of wavelength range
The design of large-scale integrated circuits greatly improves the scalability and reliability of the system
Improved and optimized optical path design, imported light sources and receivers result in high system performance and reliability
Rich measurement methods, with wavelength scanning, time scanning, multi-wavelength measurement, multi-order derivative measurement (optional), dual wavelength, three-wavelength (optional) DNA protein measurement (optional) and other measurement methods, can meet the requirements of different measurements, and can be directly displayed on the 6-inch large screen
According to user’s requirements can be selected single hole frame, manual four frame, manual eight frame, automatic eight frame, glass frame, test tube frame, 1cm color frame, 5cm color frame, 10cm color frame, etc
Measurement data can be output via printer with USB interface
Power off to save measurement parameters and data, easy to use
More precise and flexible measurement requirements such as spectral scanning can be achieved through PC software control
Technical indicators and basic parameters
Wavelength range: 190 ~ 1100nm
Spectral bandwidth: 1.8nm
Wavelength accuracy: ±0.3nm
Wavelength reproducibility: ≤0.1nm
transmission ratio accuracy: + / – 0.3% tau tau (0-100%) + / – 0.002 A + / – 0.003 (0 ~ 0.5 A) A (0.5 A ~ 1 A)
by transmission ratio method: plus or minus 0.15% tau tau (0-100%) + / – 0.001 A + / – 0.0015 (0 ~ 0.5 A) A (0.5 A ~ 1 A)
Stray light: ≤0.03% τ (220nm NaI, 340nm NaNO2)
Stability: 0.0005A/h (500nm after preheating)
Metering method: transmittance, absorbance, concentration, energy
Wavelength adjustment: automatic adjustment
Luminosity range: -4 ~ 4A
Display mode: 6-inch high brightness LCD screen
Detector: imported silicon photodiode
Light source: imported deuterium lamp, imported tungsten lamp
Power supply: AC 220V/50Hz or 110V/60Hz
Power: 120W
Instrument size: 560×450×230mm
The UV-1700 successfully achieves the strict requirements of high precision and high reliability measurement, and can meet the requirements of various applications, which can be used in biological research, biological industry, pharmaceutical analysis, pharmaceutical, teaching research, environmental protection, food hygiene, clinical testing, health and epidemic prevention and other fields.
Wide wavelength range, can meet the requirements of various fields of wavelength range
The design of large-scale integrated circuits greatly improves the scalability and reliability of the system
Improved and optimized optical path design, imported light sources and receivers result in high system performance and reliability
Rich measurement methods, with wavelength scanning, time scanning, multi-wavelength measurement, multi-order derivative measurement (optional), dual wavelength, three-wavelength (optional) DNA protein measurement (optional) and other measurement methods, can meet the requirements of different measurements, and can be directly displayed on the 6-inch large screen
According to user’s requirements can be selected single hole frame, manual four frame, manual eight frame, automatic eight frame, glass frame, test tube frame, 1cm color frame, 5cm color frame, 10cm color frame, etc
Measurement data can be output via printer with USB interface
Power off to save measurement parameters and data, easy to use
More precise and flexible measurement requirements such as spectral scanning can be achieved through PC software control
Technical indicators and basic parameters
Wavelength range: 190 ~ 1100nm
Spectral bandwidth: 1.8nm
Wavelength accuracy: ±0.3nm
Wavelength reproducibility: ≤0.1nm
transmission ratio accuracy: + / – 0.3% tau tau (0-100%) + / – 0.002 A + / – 0.003 (0 ~ 0.5 A) A (0.5 A ~ 1 A)
by transmission ratio method: plus or minus 0.15% tau tau (0-100%) + / – 0.001 A + / – 0.0015 (0 ~ 0.5 A) A (0.5 A ~ 1 A)
Stray light: ≤0.03% τ (220nm NaI, 340nm NaNO2)
Stability: 0.0005A/h (500nm after preheating)
Metering method: transmittance, absorbance, concentration, energy
Wavelength adjustment: automatic adjustment
Luminosity range: -4 ~ 4A
Display mode: 6-inch high brightness LCD screen
Detector: imported silicon photodiode
Light source: imported deuterium lamp, imported tungsten lamp
Power supply: AC 220V/50Hz or 110V/60Hz
Power: 120W
Instrument size: 560×450×230mm
Part Six: About us
Shanghai Macylab Instrument Co., LTD. (hereinafter referred to as Macylab), is a high-tech enterprise with independent intellectual property rights, Macylab’s entrepreneurial philosophy “science and technology – because you change”, and take this as the enterprise purpose, continuous exploration, bold innovation. Especially in the field of analytical testing instruments, we have continuously developed advanced products, making us a supplier of high-quality instrument resources.
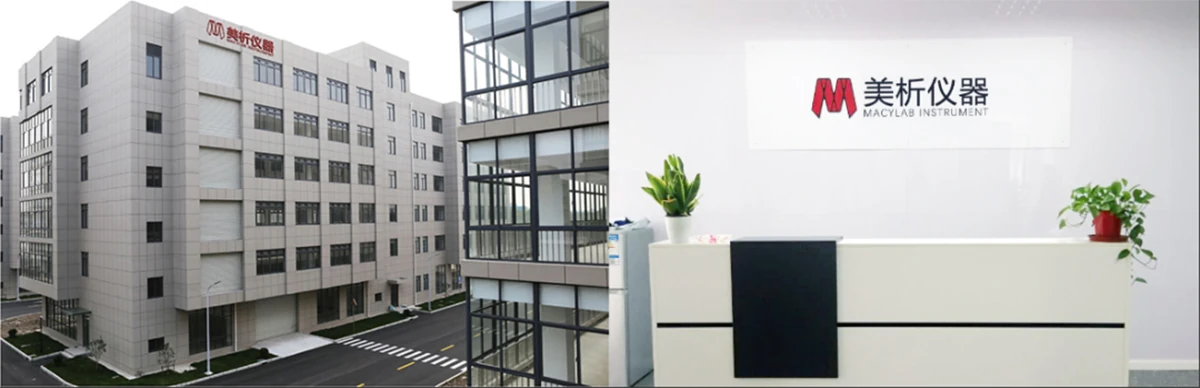
Main spectral instruments: visible spectrophotometer, UV-visible spectrophotometer, atomic absorption spectrometer, atomic fluorescence photometer, ICP-AES, ICP-MS, life science instruments: Ultramicrospectrophotometer, automatic nucleic acid extraction instrument, at present, our products have been widely used in organic chemistry, inorganic chemistry, biochemistry, medicine, environmental protection, metallurgy, petroleum, agriculture and other fields. At the same time, with the rich experience accumulated in product mechanical structure, optical design, electrical application and software development, combined with the latest practical needs of the market, the company will launch a number of new analytical instruments in the near future.
Macylab attaches great importance to the introduction and training of talents, the human factor is a core factor for the sustainable development of an enterprise, so Macylab fully respects every employee, and truly “build a platform and realize yourself”. To this end, the company has established a strong training team to provide comprehensive training for in-service employees and help employees develop career plans, in order to develop the company and employees together. At the same time, the United States analysis to “family, dedication, learning” professional ethics to inspire employees, each of the United States analysis people are full of enthusiasm and professional skills, the United States presents every instrument, service every customer. The importance and respect for talents make all aspects of the company full of rigor and passion, the new design concept, the demanding requirements of high precision and high parameters, the continuous extension of the application range, all of which are perfectly presented in the advanced nature of our products; From the strict acceptance of raw materials, to the standard assembly line operation of each process flow, and then to the strict factory inspection of the quality inspection department, the harsh requirements of the company on all aspects of production have made the company establish a perfect process quality control system, and the quality of the instrument has been strongly reflected. Therefore, our products are well received by domestic and foreign users.
The headquarters and production base of Macylab are located in Shanghai, the marketing center is located in Beijing, and the R & D base is set up in Shanghai, Beijing and Jiangsu. In order to make full use of the intellectual resources around the country, the United States has also carried out in-depth scientific research cooperation with some scientific research institutions at home and abroad, and constantly transform scientific research achievements into productive forces. In order to better serve our customers, Macylab has 12 offices in China to customize application solutions that meet your needs and improve the added value of products. In the continuous service of domestic users at the same time, the United States analysis has also established a deep strategic cooperation relationship with more than 20 countries.
With the acceleration of Macylab’s pace among the ranks of global brand instruments, Macylab’s requirements for itself continue to improve, and we also hope to get care and support from all walks of life, let us work together to look forward. Technology will change because of you and me.
Macylab attaches great importance to the introduction and training of talents, the human factor is a core factor for the sustainable development of an enterprise, so Macylab fully respects every employee, and truly “build a platform and realize yourself”. To this end, the company has established a strong training team to provide comprehensive training for in-service employees and help employees develop career plans, in order to develop the company and employees together. At the same time, the United States analysis to “family, dedication, learning” professional ethics to inspire employees, each of the United States analysis people are full of enthusiasm and professional skills, the United States presents every instrument, service every customer. The importance and respect for talents make all aspects of the company full of rigor and passion, the new design concept, the demanding requirements of high precision and high parameters, the continuous extension of the application range, all of which are perfectly presented in the advanced nature of our products; From the strict acceptance of raw materials, to the standard assembly line operation of each process flow, and then to the strict factory inspection of the quality inspection department, the harsh requirements of the company on all aspects of production have made the company establish a perfect process quality control system, and the quality of the instrument has been strongly reflected. Therefore, our products are well received by domestic and foreign users.
The headquarters and production base of Macylab are located in Shanghai, the marketing center is located in Beijing, and the R & D base is set up in Shanghai, Beijing and Jiangsu. In order to make full use of the intellectual resources around the country, the United States has also carried out in-depth scientific research cooperation with some scientific research institutions at home and abroad, and constantly transform scientific research achievements into productive forces. In order to better serve our customers, Macylab has 12 offices in China to customize application solutions that meet your needs and improve the added value of products. In the continuous service of domestic users at the same time, the United States analysis has also established a deep strategic cooperation relationship with more than 20 countries.
With the acceleration of Macylab’s pace among the ranks of global brand instruments, Macylab’s requirements for itself continue to improve, and we also hope to get care and support from all walks of life, let us work together to look forward. Technology will change because of you and me.
Ready to Implement This Solution?
Contact our application specialists for a customized quote and method validation.