How Does a Visible Spectrophotometer Support Accurate Quantitative Analysis in Laboratory Applications?
Introduction
Quantitative laboratory analysis depends on reliable measurements, appropriate analytical methods, and consistent sample preparation. A visible spectrophotometer measures how much visible light a sample absorbs or transmits at a selected wavelength. When combined with a suitable calibration method, these measurements can help determine the concentration of specific substances in food, water, chemicals, and other materials.
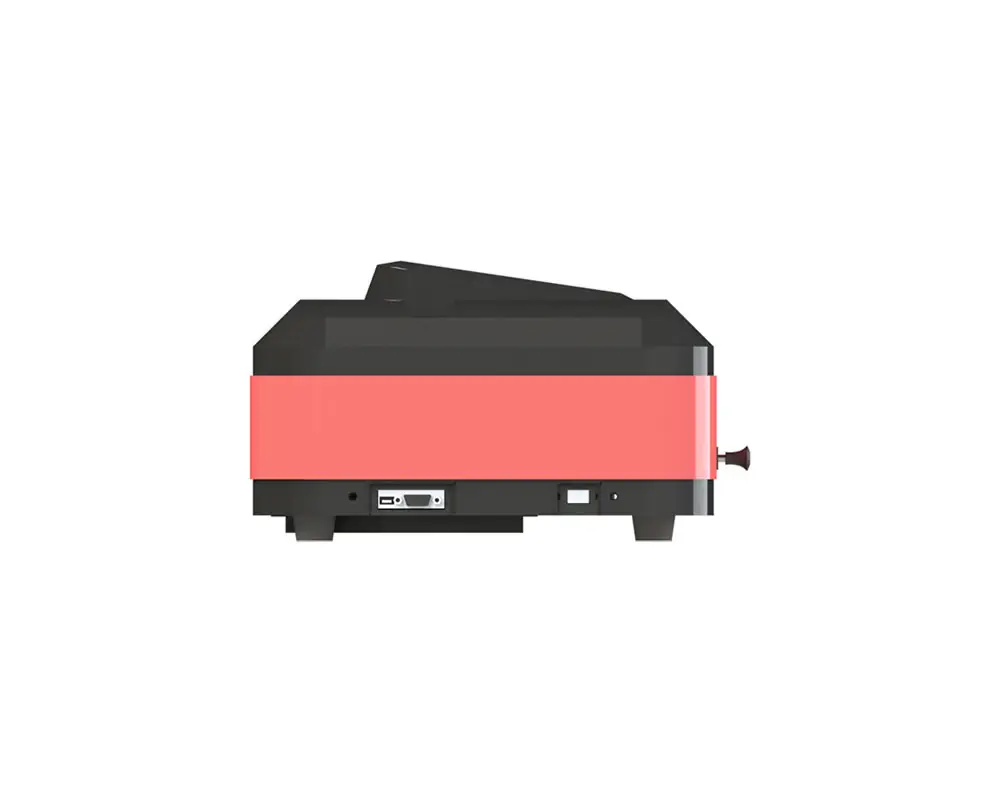
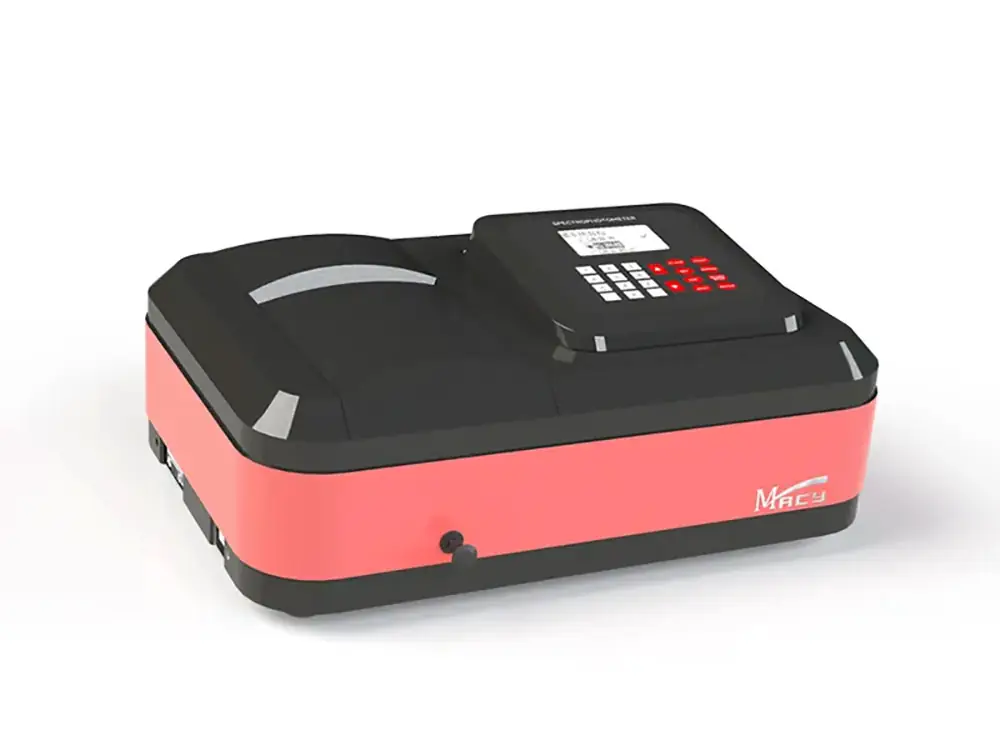
For laboratory managers and quality-control teams, choosing an instrument involves more than checking its wavelength range. Wavelength accuracy, spectral bandwidth, measurement stability, software, and compatibility with established test methods all affect its practical value. The Macylab V-1500 provides a model-specific option for laboratories evaluating equipment for routine quantitative analysis.
This guide explains how visible spectrophotometers work, which technical specifications influence measurement reliability, how molybdenum blue colorimetry is applied in sunflower seed oil phospholipid testing, and what laboratories should consider when evaluating instrument suitability, calibration, and total ownership cost.
Key Takeaways
- A visible spectrophotometer supports quantitative analysis by measuring absorbance or transmittance at selected wavelengths.
- Wavelength accuracy, spectral bandwidth, photometric performance, and stability should be evaluated against the requirements of the analytical method.
- Molybdenum blue colorimetry illustrates how visible spectrophotometry can support sunflower seed oil phospholipid testing at 650 nm.
- Instrument selection also involves calibration, data handling, accessories, documentation, service, and long-term operating costs.
What Is a Visible Spectrophotometer and How Does It Work?
The Principle of Absorbance and Transmittance
A spectrophotometer passes light through a sample and measures the light that reaches the detector. Some of the light may be absorbed by substances in the sample, while the remaining light passes through. The instrument uses this difference to determine absorbance or transmittance.
Transmittance expresses the proportion of incident light that passes through a sample. Absorbance describes how strongly the sample attenuates the light. Under suitable conditions, the Beer–Lambert law relates absorbance to concentration:
A= log10(I0/I)
Here, A)is absorbance, I0 is incident light intensity, and I is transmitted light intensity. For a given absorbing substance, absorbance can be proportional to concentration when the method operates within an appropriate range and other relevant conditions remain controlled.
Quantitative analysis usually involves a blank to account for the background signal and a calibration curve prepared from standards with known concentrations. The measured absorbance of an unknown sample is then compared with the curve to estimate its concentration. Wavelength selection matters because the analyte and other sample components may absorb light differently at different wavelengths.
Visible Spectrophotometer vs. UV-Vis Spectrophotometer
A visible spectrophotometer is suitable for methods that use wavelengths within its specified operating range. A UV-Vis spectrophotometer can also measure ultraviolet wavelengths when its optical system supports them. The appropriate choice depends on the analytical method, rather than the instrument’s name alone.
Common Laboratory Applications
Typical applications include colorimetric testing, food and edible oil analysis, water quality measurements, chemical concentration testing, and routine quality control. A Spectrophotometer may be used to measure a colored reaction product, for example, provided the selected wavelength and instrument performance meet the method’s requirements.In the analysis of edible oil, the molybdenum blue colorimetric method is a practical example, demonstrating how optical measurement can be used for the determination of phospholipid content.
Which Technical Specifications Matter When Selecting a Visible Spectrophotometer?
Wavelength Range, Accuracy, and Repeatability
The wavelength range defines which parts of the spectrum the instrument can measure. A method that requires measurement at 650 nm needs an instrument whose specified range includes that wavelength.
Wavelength accuracy describes how closely the selected or indicated wavelength matches a reference value. Wavelength repeatability describes how consistently the instrument returns to the same wavelength setting under specified conditions. Both are relevant when a method depends on a defined measurement wavelength or when results must remain comparable over time.
Spectral Bandwidth, Photometric Performance, and Stability
Spectral bandwidth affects the range of wavelengths contributing to a measurement. It can influence results when an analyte has narrow spectral features, although a narrower bandwidth does not automatically improve every analysis.
Photometric accuracy and repeatability relate to the reliability of absorbance or transmittance readings. Stray light can affect readings under certain conditions, while stability describes how consistently the instrument maintains its response over time. Optical configuration and detector characteristics may also be relevant when supported by manufacturer documentation.
These parameters should be considered together. A single specification cannot establish overall suitability without reference to the method, sample type, expected absorbance range, and operating conditions.
Display, Software, and Data Handling
Routine laboratory work may benefit from automatic wavelength setting, blank adjustment, standard-curve functions, computer connectivity, and data export. Such features can reduce manual steps and make results easier to manage, but their availability varies by model and configuration.
| Parameter | Practical significance | Information to compare |
| Wavelength range | Determines whether the required wavelength is covered | Method wavelength and instrument range |
| Wavelength accuracy | Indicates agreement with a reference wavelength | Tolerance and verification procedure |
| Wavelength repeatability | Indicates consistency of wavelength settings | Stated repeatability specification |
| Spectral bandwidth | Affects spectral resolution and measurement response | Bandwidth relative to method requirements |
| Photometric performance | Relates to the reliability of optical readings | Accuracy, repeatability, and test conditions |
| Stray light and stability | Can affect measurement reliability | Specifications and operating conditions |
| Software and connectivity | Influences routine operation and data workflows | Supported functions, interfaces, and export options |
A lab spectrophotometer should be evaluated using documented specifications and test conditions. Where a manufacturer does not publish a value for photometric accuracy, stray light, or stability, that value should remain unreported rather than being estimated.
How Is a Visible Spectrophotometer Used in Sunflower Seed Oil Phospholipid Testing?
The Principle of Molybdenum Blue Colorimetry
Molybdenum blue colorimetry provides an example of how a spectrophotometric reading contributes to a larger chemical analysis. Phosphorus-containing compounds in sunflower seed oil are converted into a suitable form before reacting to produce a colored complex for spectrophotometric measurement.
The general analytical sequence is as follows:
- The oil sample undergoes ashing to prepare the phosphorus-containing material for analysis.
- The resulting material is treated with hydrochloric acid.
- Sodium molybdate reacts with the phosphorus-containing solution to form a phosphomolybdate complex.
- Hydrazine sulfate reduces the complex, producing molybdenum blue.
- The absorbance is measured at 650 nm and compared with a phosphorus standard curve.
Sample Preparation, Standard Curve, and Measurement
The analysis starts with a representative, well-mixed oil sample. Reagents, phosphorus standards, and blank solutions are prepared according to the applicable method. A standard curve is then established under the prescribed reaction and color-development conditions.
The test solution undergoes the specified ashing and chemical treatment before its absorbance is measured at 650 nm. The protocol specifies a 1 cm cuvette. The measured response must fall within the validated linear range of the calibration curve; samples outside that range may require further treatment in accordance with the method.
The phosphorus concentration is calculated from the standard curve. A method-specific conversion factor is then used to calculate phospholipid content, where required. The instrument measures the optical response, while the final result depends on the complete analytical procedure.
Factors Affecting Measurement Reliability
Several stages can influence the result. Incomplete ashing may prevent full recovery of the phosphorus-containing material, while sample loss, inconsistent reagent preparation, or an unsuitable blank can introduce errors. A poorly prepared standard curve can also weaken the reliability of the calculated concentration.
Timing is another consideration. The protocol specifies completing the colorimetric measurement within 30 minutes after color development. It also describes duplicate testing and a reproducibility criterion. These requirements should be checked against the applicable standard before implementation.
For laboratories performing this type of analysis, a spectrophotometer instrument with suitable wavelength coverage is only one part of the measurement system. Sample treatment, chemical reactions, calibration quality, operating conditions, and calculation procedures all contribute to the final result.
How Should Laboratories Evaluate Instrument Suitability, Calibration, and Total Cost?
Matching Instrument Specifications to Analytical Methods
Instrument selection begins with the method: its required wavelength, expected absorbance range, sample type, throughput, and performance criteria. In the sunflower oil example, 650 nm is a necessary wavelength. However, wavelength coverage alone does not establish full compliance with the method or guarantee accurate results.
For water testing, a spectrophotometer for water analysis must likewise be compatible with the particular test method and the substances being measured. The required wavelength, reagents, sample preparation, calibration procedure, and applicable performance requirements should guide the selection.
Calibration and Routine Performance Verification
Routine blank correction and zero adjustment help prepare an instrument for measurement, but they are not substitutes for formal wavelength or photometric performance verification. Laboratories may use suitable reference materials, documented procedures, and maintenance records to support quality control. Verification frequency should follow applicable standards, manufacturer recommendations, or the laboratory’s own quality system rather than an arbitrary universal interval.
Total Ownership Cost and Supplier Documentation
The purchase price is only one part of the overall cost. Instrument configuration, included accessories, cuvettes, standards, reagents, software, computer compatibility, warranty, maintenance, and spare-parts availability can all affect long-term expenditure.
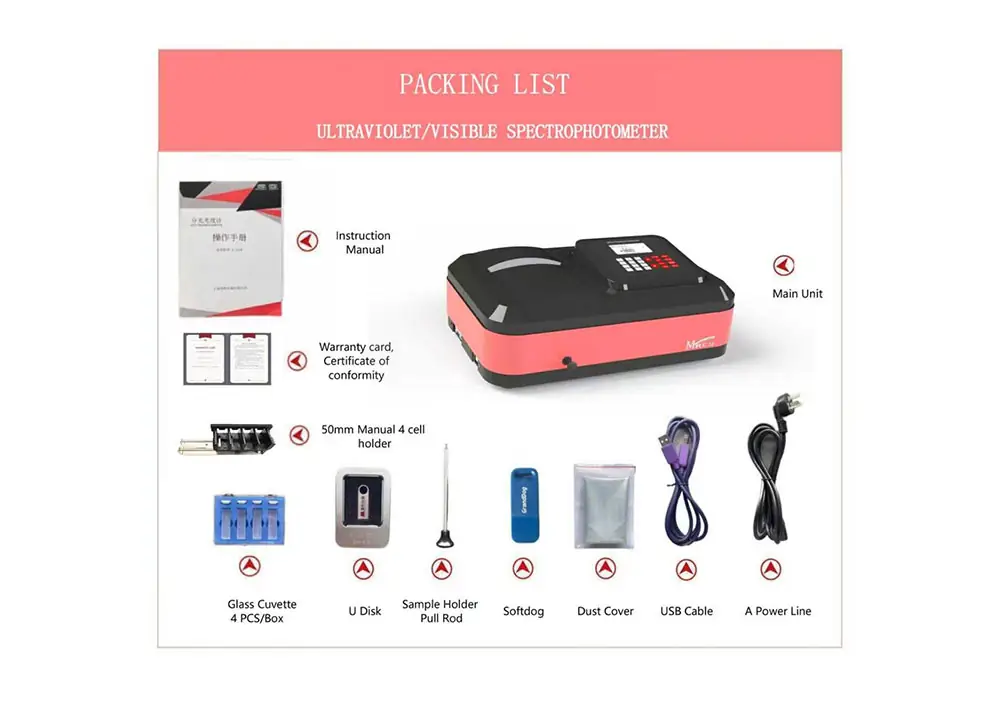
Supplier documentation also matters. Manuals, specification sheets, relevant conformity documents, delivery arrangements, and service terms help establish what is included and how the instrument will be supported. Quotations are easier to compare when the configuration and service conditions are clearly stated.
What Does the Macylab V-1500 Visible Spectrophotometer Offer?
The specifications for the Macylab V-1500:
| Specification | V-1500 |
| Wavelength range | 320–1100 nm |
| Spectral bandwidth | 2.0 nm |
| Wavelength accuracy | ±0.5 nm |
| Wavelength repeatability | 0.2 nm |
The V-1500 covers the 650 nm wavelength used in the described molybdenum blue colorimetric method for sunflower seed oil phospholipid analysis. Its suitability for this application depends on the complete test method, calibration procedure, sample preparation, and applicable performance requirements. These specifications provide a starting point for assessing compatibility with routine laboratory workflows and established analytical procedures.
About Macylab Instruments
Shanghai Macylab Instruments Co., Ltd. is a high-tech enterprise specializing in analytical and testing instruments. Guided by the philosophy “Technology Changes for You,” Macylab focuses on instrument development, optical design, electrical engineering, mechanical structure design, and software development to support laboratory testing and analytical applications.
Its product portfolio includes visible spectrophotometers, UV-Vis spectrophotometers, atomic absorption spectrometers, atomic fluorescence spectrophotometers, ICP-AES, and ICP-MS instruments, as well as life science equipment. These instruments serve a range of fields, including chemistry, biochemistry, pharmaceuticals, environmental protection, metallurgy, petroleum, and agriculture.
Macylab emphasizes quality control throughout production, from incoming material inspection and standardized assembly to factory testing. Its headquarters and manufacturing base are located in Shanghai, with a marketing center in Beijing and research and development bases in Shanghai, Beijing, and Jiangsu. The company also maintains 16 domestic offices and works with distributors in more than 20 countries, supporting its domestic and international customer network.
For laboratories evaluating the V-1500 visible spectrophotometer, Macylab’s background in analytical instrument development and its quality management processes provide additional context when assessing product specifications, application compatibility, and technical support.

Frequently Asked Questions
What Is the Difference Between a Visible Spectrophotometer and a UV-Vis Spectrophotometer?
A visible spectrophotometer measures within its specified visible-region range. A UV-Vis model can also measure ultraviolet wavelengths if its optical configuration supports them. The choice depends on the wavelength required by the analytical method.
Which Specifications Matter Most When Choosing a Visible Spectrophotometer?
Wavelength range, wavelength accuracy and repeatability, spectral bandwidth, photometric performance, stability, and software are important considerations. Their relative importance depends on the method, sample type, expected absorbance, and laboratory quality requirements.
Can a Visible Spectrophotometer Measure Phospholipid Content in Sunflower Seed Oil?
It can measure the molybdenum blue color response at 650 nm in the described method. The final phospholipid result, however, requires the complete chemical analysis, a suitable phosphorus standard curve, and the prescribed calculation.
How Much Does a Visible Spectrophotometer Cost?
Price varies with configuration, performance specifications, software, accessories, warranty, and service. Comparing quotations for equivalent configurations provides a clearer basis for evaluating total cost than considering the initial purchase price alone.
Conclusion
A visible spectrophotometer supports quantitative analysis by measuring absorbance or transmittance under defined analytical conditions. Reliable results depend on suitable instrument specifications, consistent sample preparation, appropriate calibration, and routine performance verification. The Macylab V-1500 features a wavelength range of 320–1100 nm, a spectral bandwidth of 2.0 nm, wavelength accuracy of ±0.5 nm, and wavelength repeatability of 0.2 nm, providing a basis for evaluating its compatibility with routine laboratory applications.
Contact Macylab for V-1500 specifications, application compatibility, accessory details, and a quotation tailored to your laboratory requirements.
Here is the link to Macylab Instruments Inc.’s YouTube channel.
http://www.youtube.com/@MacylabInstrumentsInc